
 formulation when batch size up-scaling is done in the same container and the powder’s physical properties change throughout the process. Blending process investigation is carried out on laboratory-scale equipment coupled with a near-infrared sensor which has a significant advantage in defining process criticalities leading to successful scale-up on industrial-size equipment.)

1. Introduction
Physical characteristics of pharmaceutical blends are important in preventing powder flowing and in minimising dosage deviations in capsule filling and tableting. The content of the active pharmaceutical ingredient (API) in the final dosage form is extremely important to guarantee adequate end-product quality.
Blending is a process where two or more compounds are mixed to achieve a homogenous product. To achieve that, three main powder-blending mechanisms are involved: convection, diffusion and shear, which often interfere with each other according to the type of blender used.
Tumble blenders accomplish mixing by allowing free-flowing material to move within a partially filled rotating container. The capacity usually represents about 50% of the internal volume of the blender [1.].
Powder mixing is influenced by mixing time, particle size, shape, density and type of powders as well as the design of the mixer used [2.]. During mixing, different particles can behave differently and the mixtures undergo mixing and demixing in successive stages during this process [3.]. The particle size distribution of the ingredients used in a powder mixture is one of the key factors that determine the homogeneity of the mixture [4.] and also affects other powder properties such as bulk density, flowability and compressibility [5.,6.].
In industrial practice, blending quality is often determined by sampling with a thief probe, followed by an off-line analysis of the sampled material. Another method is near-infrared (NIR) spectroscopy that allows non-invasive and on-line measurements. By combining NIR spectroscopy and multivariate methods, critical quality characteristics of powders can be determined.
This experimental study investigates the mixing behaviour of amoxicillin as a high-dosed API (96% w/w) and talc and magnesium stearate as excipients for two different filling levels in a blender (21% and 55%). We used a miniaturised wireless NIR sensor to monitor the blending process. The sensor assures high reading accuracy through the sapphire window flanged on the lid, selected as the best dead-zone-free position. The presence of an accelerometer can ensure reproducible data acquisition during each bin rotation, providing a clearer picture of what occurred during the process and how the process parameters can impact physical characteristics of the powder during blending.
In summary, our study shows one of the advantages in real-time spectroscopic monitoring of blending, minimising the number of experimental tests and eliminating the possible erroneous results observed through off-line analysis performed on sampled blends once produced.
2. Equipment and Materials
2.1. Materials
Formulation includes API (amoxicillin trihydrate), talc and magnesium stearate.
2.2. Equipment
Laboratory scale Cyclops Lab equipped with a 15-litre bin (IMA S.p.A., Active Division, Ozzano dell’Emilia, Italy), pilot-scale Cyclops Mini equipped with a 100- litre bin (IMA S.p.A., Active Division, Ozzano dell’Emilia, Italy) and industrial-scale Canguro 1200 equipped with a 1200-litre bin (IMA S.p.A., Active Division, Ozzano dell’Emilia, Italy).
2.3. In-process analysis
A miniaturised near-infrared (NIR) sensor (MicroNIR® PAT-W, Viavi Solutions Inc., Scottsdale, AZ, USA) was installed as the process analytical technology (PAT) unit. The sensor was located on the upper part of the lid of the bins of the batch blender. The NIR sensor utilised a Linear Variable Filter (LVF) as a dispersive element which provides a position-dependent dispersive optical element ideally suited for use in compact instruments requiring high spectral resolution, covering a wavelength range of 950 nm to 1650 nm. Raw spectra were pre-treated using a Standard Normal Variate and the first derivative via a Savitsky–Golay filter (11 pt, second polynomial order), before being analysed online using the moving block method with the F-Test. The wavelength range was selected to cover nearly the entire spectra, except for the lateral parts where the derivative pre-treatments create artificial noise. This qualitative method involved collecting independent data to compare the variances of two blocks of data at a 95% confidence interval, enabling a real-time analysis of the material’s chemical composition and ensuring it remained under control throughout the entire run.
2.4. Powder characterisation
2.4.1. Powder Density
The bulk and tapped densities are measured using Ph. Eur. Method 3. Specifically, the powder was added to a 100 mL graduated cylinder and the mass was consequently determined; the cylinder was then placed on an automatic tapping device (Erweka, Germany). The Hausner ratio (HR) was calculated by dividing the tapped density (TD) by the bulk density (BD) and the Carr’s Index (CI) was calculated according to equation ( 1)
![]()
2.4.2. Particle Size Distribution
Particle Size Distribution (PSD) of blends is measured to detect possible changes in particle size throughout the process. Measurements are conducted by using the sieve method on a Giuliani IG/S/1 (Giuliani Tecnologie Srl, Torino, Italy) sieve shaker equipped with a set of sieves (63 µm, 90 µm, 125 µm, 250 µm, 355 µm, 500 µm, 710 µm and 1000 µm) on a representative sample of 100 grams of blends, by sieving for 6 minutes and weighing the separated fractions of the powder.
3. Detailed case description
According to the current manufacturing procedure, the blend is obtained by mixing all components in a stated order for 20 minutes at 5 rpm in a 1200-litre bin occupying 21% of total capacity. The downstream capsule filling unit operation proved to be of high quality in terms of weight uniformity and efficient in terms of manufacturing speed.
The aim of the investigation is to determine the ideal blending process parameters to mix an increased batch size of 450 kg in the same bin size. Consequently, the bin filling increases from 21% up to 55% (calculated on bulk density of the starting mixture).
The first evaluation is carried out on a laboratory-scale blender to maximise the results and minimise the amount of raw materials involved (API and excipients). The second step is up-scaling to a pilot bin size to prove the results obtained in the first step. This is the last verification prior to performing the engineering batch in an industrial-scale bin.
3.1. Laboratory scale
The main objective is to achieve the blend uniformity evaluating the ideal mixing time, mixing speed and bin filling, and measuring the physical powder properties.
Blend uniformity is measured through the use of an NIR spectrometer thanks to the possibility of analysing the entire blending profile from the first heterogeneous moment to the final homogeneous one. Studying the behaviour of the mixing process and how it changes, modifying the critical process parameters (CPPs), is key to understanding the design space of this mixture.
Analysing the CPPs one by one:
-
The bin-filling parameter is fixed hypothetically at 55% as the desired volume for production scale;
-
The blending time is fixed at 30 minutes, which is considered long enough to fully capture the way the powder behaves and still plausible for a real blending process;
-
The blending speed is the factor used to understand how blend uniformity changes inside the design space. The values selected for the blending speed are 5 rpm, 10 rpm, 15 rpm and 20 rpm.
Four preliminary runs are carried out using different mixing speeds while mixing time and bin filling are kept constant.
Then, two additional runs are carried out to evaluate:
-
the behaviour of the sole native Amoxicillin when mixed at different mixing speeds (5 rpm, 10 rpm, 15 rpm, 20 rpm) for 5 minutes’ mixing time and 55% fill level;
-
the blend uniformity on a scaled-down batch, which represents the current process (bin filling 21%, mixing speed 5 rpm, mixing time 20 minutes).
The final blends coming from the six runs are characterised in terms of density, flowability index and particle size distribution.
3.2. Pilot scale
Two runs are carried out aimed at up-scaling the process in a larger container, verifying the blending process conditions resulting from the laboratory-scale experimental part.
3.3. Industrial scale
One engineering batch is carried out on an industrial-scale blender using the outcome process conditions from laboratory and pilot scale.
Raw materials are dispensed and pre-sieved through a 2000 µm sieve; finally, are loaded by gravity according to the stated order: Amoxicillin, Talc and Magnesium Stearate.
4.1. Laboratory scale
Blends resulting from all six runs are characterised in terms of bulk and tapped density, flowability index, compressibility index (Table 1) and particle size distribution (Figure 1).
Table 1. RUNs physical characteristics from lab scale.
-
TEST
RUN 1
RUN 2
RUN 3
RUN 4
RUN 5
RUN 6
Sample Type
Blend
Blend
Blend
Blend
API Mixed
Blend
Mixer Speed [RPM]
5
10
15
20
5-10-15-20
5
Mixing Time [min]
30
30
30
30
10
20
Bulk Density [g/ml]
0,660
0,664
0,695
0,668
0,648
0,681
Tapped Density [g/ml]
0,846
0,862
0,858
0,871
0,810
0,862
Flowability Index [%]
22
23
19
23
20
21
Compressibility Index
1,28
1,30
1,23
1,30
1,25
1,27
All the blends show negligible differences in terms of density, flowability and compressibility index.

Figure 1. RUNs particle size distribution lab scale.
Particle size distribution profile on run 6 (taken as reference) looks similar on blends obtained from runs 2, 3 and 4. To achieve the similarity in terms of physical characteristics, a higher mixing speed (more than 5 rpm, run 1) should be used to mix a 55% fill level batch.
A representative sample of native Amoxicillin (run 5) off-line analysed in duplicate shows a particle size distribution confirmed by the profile observed on NIR spectra (Figure 2) from which the difference between the low speed compared to the higher ones is clearly visible.

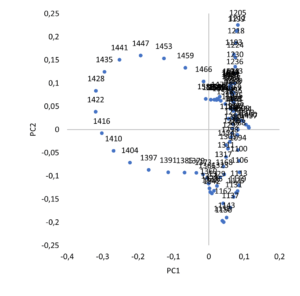
Figure 2. PCA analysis for the different mixing speeds. Left: PCA score. Right: PCA loadings.
Furthermore, the results obtained from the multivariate analysis of the NIR spectra (Figure 3) allow you to:
– determine the maximum number of revolutions (between 100 revs and 125 revs) to obtain a stable blend uniformity (minimum values reached);
– determine the optimal mixing speed (between 10 rpm and 20 rpm) and time (between 5 and 10 minutes) to be set during the two scale-up runs in a pilot scale.

Figure 3. NIR Spectra relative standard deviation trend.
4.2. Pilot scale
Based on the results obtained from the laboratory-scale analysis, the runs for the pilot scale (run 7 and run 8) are selected to be performed at 10 rpm for 10 minutes and 20 rpm for 5 minutes respectively in order to keep the number of revolutions (100 revs) constant.
Blends resulting from run 7 and run 8 are characterised in terms of bulk and tapped density, flowability index, compressibility index (Table 2) and particle size distribution (Figure 4).
Table 2. RUNs physical characteristics from pilot scale.
-
TEST
RUN 1
RUN 2
Sample Type
Blend
Blend
Mixer Speed [RPM]
10
20
Mixing Time [min]
10
5
Bulk Density [g/ml]
0,695
0,682
Tapped Density [g/ml]
0,848
0,853
Flowability Index [%]
18
20
Compressibility Index
1,22
1,25
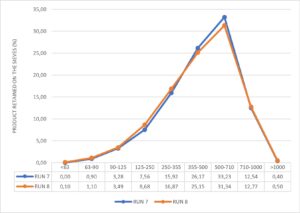
Figure 4. RUNs particle size distribution pilot scale.
Both the blends show similar physical properties of the powder when blending is performed in a pilot-scale bin under different blending conditions.
NIR spectra qualitative analysis (MBSD) demonstrates that 100 revolutions are appropriate to reach the blend uniformity on a pilot batch size (Figure 5).
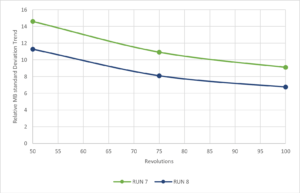
Figure 5. NIR Spectra relative standard deviation trend.
Furthermore, lower value of MBSD profile variability was observed during run 8 (mixing speed 20 rpm) demonstrating that higher speed improves mixing efficiency.
4.3. Industrial scale
An engineering batch (450 kg) is performed on an industrial-scale blender at 20 rpm for 5 minutes, achieving high stability in terms of capsule filling weight deviation and increasing the process efficiency overall.
5. Conclusions
Considering the results obtained, blending process parameters on an industrial-size bin (1200 litres) for a 450 kg batch are optimised in terms of lower mixing time with respect to the current process (150 kg batch) and higher quality of the final product.
Author Contributions: M.M. provided materials for the experiments and sponsored the study; G.M and L.M designed the study; G.M. and L.M. performed the experiments; G.M., L.M. and M.M. analysed the results; G.M. and C.F. conceived the idea to write the manuscript; G.M. and L.M. wrote the manuscript; M.M. approved the manuscript. All authors discussed the results. All authors have read and agreed to the published version of the manuscript.
References
-
Cullen P.J., Romañach R. J., Abatzoglou N., Rielly C. D. Pharmaceutical Blending and Mixing. 2015. pp. 293.
-
Barbosa-Cánovas, G.V., Ortega-Rivas, E., Juliano, P., & Yan, H. (2005c). Mixing. In Food Powders – Physical Properties, Processing and Functionality, Kluwer Academic/Plenum Publishers: New York, 221-244.
-
Berk., Z. (2008). Mixing. In Food Process Engineering and Technology. ISBN: 978-0-12-373660-4,175-194
-
Chowhan, Z.T., & Linn, E.E. (1979). Mixing of Pharmaceutical Solids. I. Effect of Particle Size on Mixing in Cylindrical Shear and V-Shaped Tumbling Mixers. Powder Technology, 24, 237-244.
-
Barbosa-Canovas, G.V., Malave-Lopez, J., and Peleg, M. (1987). Density and Compressibility of Selected Food Powders Mixtures1. Journal of Food Process Engineering, 10, 1-19
-
Peleg, M. (1978). Flowability of food powders and methods for its evaluation—a review